The Complete SIP Investment Guide 2026: Strategy, Returns & Tax Rules
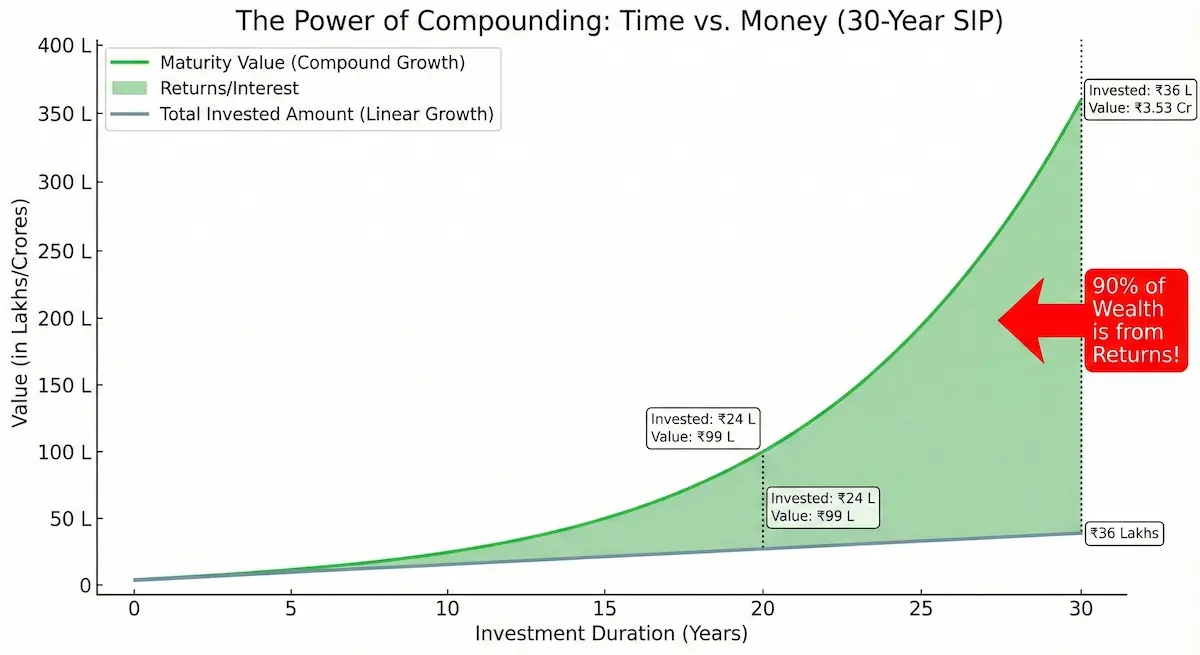
SIP (Systematic Investment Plan) lets you invest as low as ₹500/month in mutual funds through auto-debit. Historical 20-year SIP returns average 12-15% CAGR (compared to 6-7% in FDs). A ₹10,000 monthly SIP for 20 years can grow to ₹99 lakhs (invested: ₹24L).
*Historical data, not guaranteed | **Except ELSS (3-year lock-in)
Want to know your wealth potential? Calculate how much your monthly SIP can grow in 10, 20, or 30 years.
Calculate My SIP ReturnsSIP (Systematic Investment Plan) is a disciplined investment method where you invest a fixed amount regularly (monthly, quarterly, or weekly) in mutual funds through auto-debit, regardless of market conditions. It's India's most powerful wealth-creation tool for retail investors, with over 7.8 crore active SIP accounts contributing ₹19,000+ crore monthly as of February 2026.
Unlike lump sum investing where you need to time the market, SIP leverages rupee-cost averaging to buy more units when markets fall and fewer when they rise, significantly reducing your average purchase cost. This guide covers everything from starting your first SIP to advanced tax optimization strategies, helping you build long-term wealth systematically.

Start your wealth creation journey with systematic investing.
What is SIP? (Systematic Investment Plan)
A Systematic Investment Plan (SIP) is an investment method that allows you to invest a fixed amount regularly in mutual funds, creating a disciplined approach to wealth accumulation. Think of it as a recurring deposit, but with market-linked returns instead of fixed bank interest rates.
How It Works
- Fixed Amount: Invest ₹500-₹1L+ monthly based on your budget
- Auto-Debit: Money automatically deducted from your bank account
- Units Allocation: You receive units based on current NAV (Net Asset Value)
- Flexible: Pause, stop, or modify amount anytime (except ELSS)
- Frequency: Choose monthly, quarterly, or weekly SIP
Why SIP Works
- Rupee Cost Averaging: Buy more units when price low, fewer when high
- Power of Compounding: Earn returns on your returns over time
- Eliminates Timing Risk: No need to predict market highs/lows
- Builds Discipline: Forced savings ensure regular investing
- Accessible: Start with as little as ₹500
SIP vs Traditional Investing
Understanding how SIP compares to traditional investment methods helps you make informed decisions based on your financial goals and risk appetite.
| Feature | SIP (Mutual Funds) | Lump Sum | RD (Recurring Deposit) |
|---|---|---|---|
| Investment Pattern | Fixed amount regularly | One-time large amount | Fixed amount regularly |
| Expected Returns | 12-15% (Equity)* | Variable (Timing dependent) | 5.5-7.5% (Guaranteed) |
| Market Risk | Averaged (Rupee Cost Averaging) | High (Timing Risk) | Zero |
| Minimum Amount | ₹500/month | ₹5,000+ | ₹100/month |
| Liquidity | High (Redeem anytime) | High | Penalty on premature withdrawal |
| Lock-in Period | None (Except ELSS: 3 years) | None | Usually 5 years |
| Tax Benefits | ELSS: 80C up to ₹1.5L | ELSS: 80C up to ₹1.5L | 80C up to ₹1.5L (5-year RD) |
*Historical equity fund returns 2006-2026. Past performance doesn't guarantee future returns. Mutual fund investments are subject to market risk.
- Rupee-Cost Averaging: Automatic buy-low strategy reduces average purchase cost
- Disciplined Investing: Auto-debit ensures you never miss an investment
- Power of Compounding: Exponential growth over 10+ years
- Flexibility: Start small (₹500) and scale up with income growth
How to Start Your First SIP (Step-by-Step)
Starting a SIP is simpler than opening a bank account. Follow these 6 steps to begin your wealth creation journey today. No prior investment experience required!
Complete KYC (One-Time Process)
Complete your KYC verification online (eKYC) or offline using Aadhaar, PAN card, and bank details. This is a one-time mandatory process for all mutual fund investments in India as per SEBI regulations.
Timeline: 24-48 hours for online eKYC | Required: PAN card, Aadhaar, Bank Account Statement, Passport-size Photo, Signature
Choose Investment Platform
Select between Direct Plans (via AMC website - 0.5-1% lower expense ratio) or Regular Plans through apps like Groww, Zerodha Coin, ET Money, Paytm Money, or traditional distributors.
Pro Tip: Direct plans save ₹2-3 lakhs over 20 years on a ₹10K SIP due to lower expense ratio. Choose regular only if you need advisory support.
Select Fund Category & Scheme
Choose based on investment goal and time horizon: Equity Funds 7 years wealth creation), Debt Funds (3-5 years stability), Hybrid Funds (balanced 60:40 equity-debt mix).
Beginner-Friendly: Start with Index Funds (Nifty 50/Sensex) or Flexi-Cap Funds for automatic diversification across market caps.
Decide SIP Amount & Date
Start with 10-20% of your monthly income. Choose a SIP date close to your salary credit date (5th, 7th, or 10th works best for salaried individuals) to ensure sufficient balance.
Smart Move: Split into 2-3 funds (Index + Flexi-Cap + Mid-Cap) on different dates (5th, 10th, 15th) for better rupee-cost averaging.
Set Up Auto-Debit Mandate
Register an auto-debit mandate (E-NACH) with your bank for hassle-free monthly deductions. You can set a maximum debit limit to control spending.
One-Time Setup: Takes 2-3 days for bank approval. Once active, investments happen automatically without manual intervention.
Monitor & Step-Up Annually
Review your portfolio quarterly. Enable SIP step-up to increase your monthly investment by 10% annually, automatically adjusting with your salary hikes and inflation.
Step-Up Magic: A ₹10K SIP with 10% annual step-up creates 40% more wealth than a static SIP over 20 years!
Total Time to Start: Complete the process in 2-3 days. First SIP deduction happens on your chosen date next month. That's it—you're now an investor!
How SIP Works: The Magic of Compounding
SIP's real power lies in compounding—earning returns on your returns. Albert Einstein allegedly called compound interest "the eighth wonder of the world." The longer you stay invested, the more dramatic the wealth creation becomes.
| Period | Total Invested | Maturity Value | Wealth Gain | Multiple |
|---|---|---|---|---|
| 5 Years | ₹6,00,000 | ₹8,16,000 | ₹2,16,000 | 1.36x |
| 10 Years | ₹12,00,000 | ₹23,00,000 | ₹11,00,000 | 1.92x |
| 15 Years | ₹18,00,000 | ₹50,00,000 | ₹32,00,000 | 2.78x |
| 20 Years | ₹24,00,000 | ₹99,00,000 | ₹75,00,000 | 4.13x |
| 25 Years | ₹30,00,000 | ₹1,89,00,000 | ₹1,59,00,000 | 6.30x |
| 30 Years | ₹36,00,000 | ₹3,53,00,000 | ₹3,17,00,000 | 9.81x |
With SIP, you automatically buy more units when the market is down and fewer when it's up, reducing your average cost per unit over time. This eliminates the need to time the market.
Example: ₹10,000 Monthly SIP Over 6 Months
| Month | NAV (₹) | Investment | Units Bought |
|---|---|---|---|
| Jan | ₹100 | ₹10,000 | 100 |
| Feb | ₹90 | ₹10,000 | 111.11 |
| Mar | ₹80 | ₹10,000 | 125 |
| Apr | ₹85 | ₹10,000 | 117.65 |
| May | ₹95 | ₹10,000 | 105.26 |
| Jun | ₹105 | ₹10,000 | 95.24 |
| Total | ₹60,000 | 654.26 units | |
Average NAV (Simple)
₹92.50 (₹555/6)
Your Average Cost (SIP)
₹91.70 (₹60K/654 units)
You saved ₹0.80 per unit through rupee cost averaging. Over 10,000 units, that's ₹8,000 in savings—automatically!
SIP vs Lump Sum: The Verdict
The eternal debate: Should you invest ₹12 lakh at once or ₹1 lakh monthly for 12 months? The answer depends on market conditions and your risk appetite.
| Market Scenario | SIP Return | Lump Sum Return | Winner |
|---|---|---|---|
| Bull Market (Steady Rise) | 38-45% | 52-68% | Lump Sum ✓ |
| Bear Market (Crash -20%+) | 12-15% | -10 to +5% | SIP ✓ (Big Win) |
| Volatile Market (Up & Down) | 14-17% | 11-13% | SIP ✓ |
| 20-Year Average (All Conditions) | 12.8% | 11.9% | SIP ✓ (Slight Edge) |
- Market is volatile or bearish
- You are a beginner investor
- You have regular income (salary)
- You want to avoid market timing risk
- You are risk-averse and need peace of mind
- You want disciplined, automated investing
- Market is at correction bottom (-15% to -20%)
- Strong bull run is expected to follow
- You have windfall money (bonus, inheritance, sale proceeds)
- You have 10+ year horizon to recover from losses
- You are experienced in market timing
- You can handle short-term volatility
The Hybrid Strategy (Recommended for Windfalls)
If you suddenly receive a large sum (₹10-50 lakhs), use the 50-30-20 Rule to balance both approaches:
Invest immediately as Lump Sum in Index/Large Cap funds
Park in Liquid Fund, then STP (Systematic Transfer) to equity over 6-12 months
Continue your regular salary SIP for discipline
This strategy gives you market exposure immediately while still benefiting from rupee cost averaging on the remaining 30%.
Best SIP Amount by Age & Income
Your SIP amount should align with your age, income, and financial goals. Here's a comprehensive age-wise strategy to maximize wealth creation.
Just started career, building emergency fund
Typical Income: ₹20,000 - ₹40,000/month
Primary Goals: Build investment habit, emergency fund (3-6 months expenses)
| Monthly Income | Recommended SIP | Goal (10 years) |
|---|---|---|
| ₹25,000 | ₹2,500-₹5,000 (10-20%) | ₹10-18L corpus |
| ₹35,000 | ₹5,000-₹7,000 (15-20%) | ₹18-25L corpus |
Asset Allocation
- • 90% Equity (Small/Mid Cap focus)
- • 10% Debt (Emergency fund building)
- • Aggressive growth phase
Recommended Funds
- • Flexi Cap Fund (40%)
- • Mid Cap Fund (30%)
- • Small Cap Fund (20%)
- • Liquid Fund (10%)
Peak earning growth, major life goals (marriage, house)
Typical Income: ₹40,000 - ₹1,00,000/month
Primary Goals: House down payment, marriage, child planning
| Monthly Income | Recommended SIP | Goal (15 years) |
|---|---|---|
| ₹50,000 | ₹10,000-₹15,000 (20-30%) | ₹50-75L corpus |
| ₹75,000 | ₹18,000-₹25,000 (25-35%) | ₹90L-₹1.25Cr corpus |
| ₹1,00,000+ | ₹25,000-₹40,000 (25-40%) | ₹1.25-₹2Cr corpus |
Asset Allocation
- • 80% Equity (Diversified mix)
- • 15% Debt (Goal-based parking)
- • 5% Gold (Inflation hedge)
Recommended Funds
- • Flexi Cap Fund (30%)
- • Index Fund - Nifty 50 (25%)
- • Mid Cap Fund (25%)
- • Debt Fund (15%) + Gold ETF (5%)
Highest income phase, retirement planning begins
Typical Income: ₹1L - ₹3L/month
Primary Goals: Child education fund, retirement corpus, debt repayment
| Monthly Income | Recommended SIP | Goal (20 years) |
|---|---|---|
| ₹1,50,000 | ₹50,000-₹75,000 (33-50%) | ₹2-₹3Cr corpus |
| ₹2,50,000 | ₹85,000-₹1,25,000 (35-50%) | ₹3.5-₹5Cr corpus |
| ₹3,00,000+ | ₹1,20,000-₹1,80,000 (40-60%) | ₹5-₹7Cr corpus |
Asset Allocation
- • 70% Equity (Large cap heavy)
- • 25% Debt (Goal-based + safety)
- • 5% Gold (Portfolio hedge)
- • Gradual de-risking phase
Recommended Funds
- • Index Fund - Nifty 50 (40%)
- • Flexi Cap Fund (20%)
- • Mid Cap Fund (10%)
- • Debt Fund (25%) + Gold ETF (5%)
Final wealth sprint, aggressive debt reduction
Typical Income: ₹1.5L - ₹4L/month
Primary Goals: Maximize retirement corpus, clear all debts, health insurance
| Monthly Income | Recommended SIP | Strategy |
|---|---|---|
| ₹2,00,000 | ₹80,000-₹1,20,000 (40-60%) | Conservative growth |
| ₹3,50,000+ | ₹1,40,000-₹2,10,000 (40-60%) | Capital preservation focus |
Asset Allocation
- • 50% Equity (Large cap only)
- • 40% Debt (High quality bonds)
- • 10% Gold + Cash (Liquidity)
- • Focus: Capital preservation
Recommended Funds
- • Index Fund - Nifty 50 (50%)
- • Debt Fund - Corporate Bond (30%)
- • Liquid Fund (10%)
- • Gold ETF (10%)
Universal Rule Across All Ages
Step-Up Annually
Increase SIP by 10-15% every year with salary hikes to beat inflation
Emergency Fund First
Keep 6 months expenses in liquid fund before aggressive SIP
Rebalance Yearly
Review portfolio annually and shift equity to debt as you age
SIP Returns Matrix (12% CAGR Projection)
Real-world projections for different SIP amounts assuming 12% CAGR (historical average for equity funds). Notice how ₹5,000 monthly can turn into ₹1.76 Crore over 30 years!
₹5,000 Monthly SIP @ 12%
Perfect for beginners and young professionals
| Years | Invested | Maturity Value | Wealth Gain | Returns % |
|---|---|---|---|---|
| 5 | ₹3,00,000 | ₹4,08,000 | ₹1,08,000 | 36% |
| 10 | ₹6,00,000 | ₹11,50,000 | ₹5,50,000 | 92% |
| 15 | ₹9,00,000 | ₹25,00,000 | ₹16,00,000 | 178% |
| 20 | ₹12,00,000 | ₹49,50,000 | ₹37,50,000 | 313% |
| 30 | ₹18,00,000 | ₹1,76,00,000 | ₹1,58,00,000 | 878% |
₹10,000 Monthly SIP @ 12%
Ideal for mid-career professionals
| Years | Invested | Maturity Value | Wealth Gain | Returns % |
|---|---|---|---|---|
| 5 | ₹6,00,000 | ₹8,16,000 | ₹2,16,000 | 36% |
| 10 | ₹12,00,000 | ₹23,00,000 | ₹11,00,000 | 92% |
| 15 | ₹18,00,000 | ₹50,00,000 | ₹32,00,000 | 178% |
| 20 | ₹24,00,000 | ₹99,00,000 | ₹75,00,000 | 313% |
| 30 | ₹36,00,000 | ₹3,53,00,000 | ₹3,17,00,000 | 881% |
₹25,000 Monthly SIP @ 12%
For senior professionals & serious wealth builders
| Years | Invested | Maturity Value | Wealth Gain | Returns % |
|---|---|---|---|---|
| 10 | ₹30,00,000 | ₹57,50,000 | ₹27,50,000 | 92% |
| 15 | ₹45,00,000 | ₹1,25,00,000 | ₹80,00,000 | 178% |
| 20 | ₹60,00,000 | ₹2,47,50,000 | ₹1,87,50,000 | 313% |
| 25 | ₹75,00,000 | ₹4,72,50,000 | ₹3,97,50,000 | 530% |
Important Disclaimer: These projections assume consistent 12% CAGR based on historical equity fund performance (2006-2026). Actual returns may vary based on market conditions, fund selection, and economic cycles. Mutual fund investments are subject to market risk. Past performance is not indicative of future returns.
Want personalized calculations? Use our SIP calculator to see projections for your specific investment amount, time horizon, and expected returns.
Try SIP Calculator NowSIP Tax Rules 2026: Complete Taxation Guide
Understanding SIP taxation is crucial for maximizing your post-tax returns. Tax treatment differs based on fund type (equity vs debt) and holding period. Here's everything you need to know.
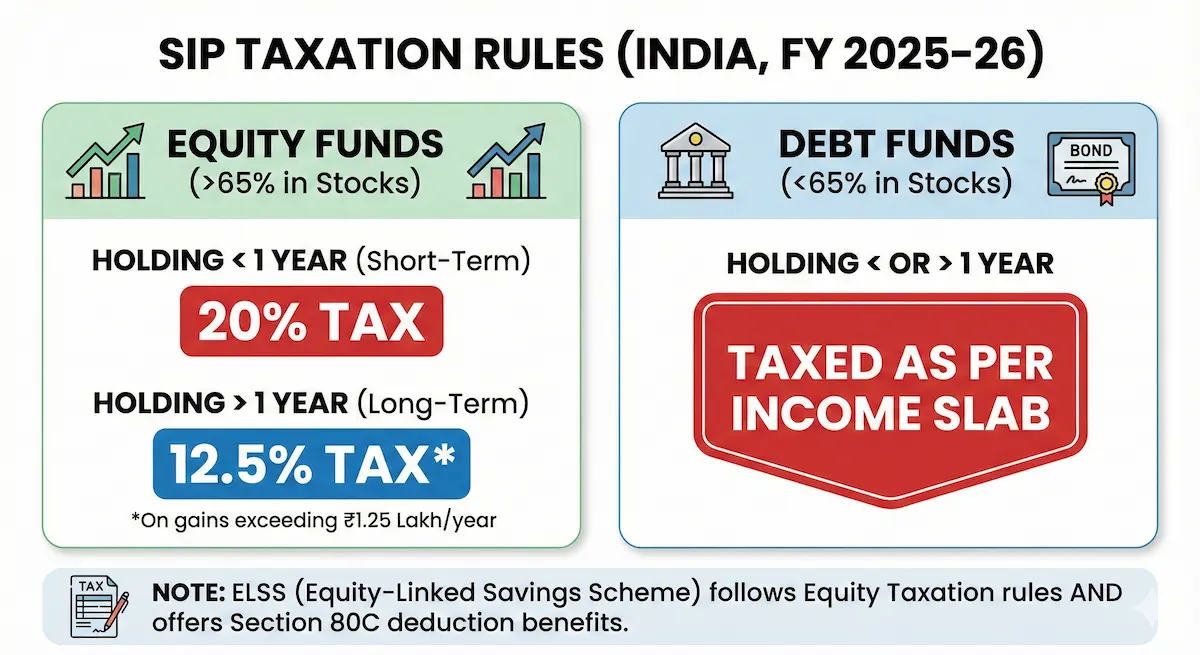
Short-Term Capital Gains (STCG)
- Holding Period: Less than 12 months
- Tax Rate: 20% on gains
- No Exemption Limit
Long-Term Capital Gains (LTCG)
- Holding Period: More than 12 months
- Tax Rate: 12.5% on gains
- Exemption: First ₹1.25 lakh gains per year tax-free
Example: You sell equity SIP units after 2 years with ₹2L profit. Tax = (₹2L - ₹1.25L) × 12.5% = ₹9,375
Taxation (All Durations)
- Tax Treatment: Gains added to your total income
- Tax Rate: As per your Income Tax Slab
- No LTCG/STCG Benefits (from April 2023)
Tax Slab Rates (2026)
- • Up to ₹3L: Nil (New regime)
- • ₹3-7L: 5%
- • ₹7-10L: 10%
- • ₹10-12L: 15%
- • ₹12-15L: 20%
- • Above ₹15L: 30%
Example: If you're in 30% tax bracket and earn ₹1L from debt funds, tax = ₹1L × 30% = ₹30,000
FIFO Method (First In, First Out)
Each SIP installment is treated as a separate investment. When you redeem units, the first units you purchased are considered sold first for tax calculation purposes.
Example: How FIFO Works
• Jan 2024: Invested ₹10K (Installment 1) → NAV ₹100
• Feb 2024: Invested ₹10K (Installment 2) → NAV ₹110
• Mar 2024: Invested ₹10K (Installment 3) → NAV ₹120
When you redeem in Feb 2025:
→ Jan installment qualifies for LTCG (>12 months) @ 12.5%
→ Feb & Mar installments = STCG (<12 months) @ 20%
ELSS (Equity Linked Savings Scheme)
Tax Benefits
- • Section 80C Deduction: Up to ₹1.5 lakh/year
- • Reduces taxable income (saves 30% tax = ₹46,500)
- • Available in both old & new tax regimes
Lock-in & Exit Tax
- • 3-year lock-in per installment
- • After 3 years: LTCG rules apply (12.5%)
- • ₹1.25L exemption available on gains
1. Hold for 12+ Months
Wait at least 12 months to qualify for LTCG (12.5% vs 20%). This alone saves 7.5% tax on your profits.
2. Utilize ₹1.25L Exemption
Plan redemptions to keep annual LTCG under ₹1.25L threshold. Spread large redemptions across years if possible.
3. Tax Loss Harvesting
Sell loss-making investments before March 31 to offset gains and reduce tax liability. Reinvest immediately if needed.
4. ELSS for 80C Benefits
Maximize ₹1.5L ELSS investment for upfront tax deduction. Better than PPF/FD as it offers equity returns + tax savings.
Choosing the Right SIP Funds
With 1,500+ mutual fund schemes in India, choosing the right funds is crucial. Here's a simple framework to build your SIP portfolio based on risk appetite and goals.
Index Funds (Low Risk)
Passively tracks market indices like Nifty 50 or Sensex. Lowest expense ratio (0.1-0.5%), guaranteed market returns. Perfect for beginners.
Large Cap Funds (Low-Medium Risk)
Invests in top 100 companies by market cap (TCS, Reliance, HDFC Bank). Stable, less volatile. Good for conservative investors.
Flexi Cap / Multi Cap Funds (Medium Risk)
Invests across all market caps dynamically based on opportunities. Best all-weather funds. Recommended for most investors.
Mid Cap Funds (Medium-High Risk)
Invests in companies ranked 101-250 by market cap. Higher growth potential but volatile. Only for risk-tolerant investors.
Small Cap Funds (High Risk)
Invests in companies ranked 251+ by market cap. Highest return potential but extreme volatility. Can fall 40-50% in bear markets.
Conservative (Age 45+)
Capital preservation focus
Moderate (Age 30-45)
Balanced growth approach
Aggressive (Age 20-30)
Maximum growth potential
Fund Selection Checklist
- Check 5-year & 10-year returns (not just 1-year)
- Prefer Direct plans (0.5-1% lower expense ratio)
- Look for consistent performance, not highest returns
- Avoid funds with AUM less than ₹500 crore
- Don't over-diversify: 3-5 funds maximum is enough
- Choose funds with stable fund manager tenure (3+ years)
SIP During Market Crash: Your Winning Strategy
Market crashes are wealth-creation opportunities for SIP investors, not disasters. Historical data proves that those who continue or increase SIPs during falls earn significantly higher returns.
Case Study: ₹10,000 monthly SIP in Sensex Index Fund from Jan 2008 to Dec 2013 (6 years). Market crashed 60% in 2008.
| Strategy | Units Accumulated | Portfolio Value (Jan 2014) | CAGR |
|---|---|---|---|
| Paused SIP during crash (panic) | 615 units | ₹12.92 Lakh | 7.8% |
| Continued SIP (disciplined) | 895 units | ₹18.80 Lakh | 16.2% |
| Doubled SIP during crash (smart) | 1,240 units | ₹26.04 Lakh | 23.1% |
Result: Doubling SIP during crash created 2x more wealth (₹26L vs ₹13L) compared to panic selling!
What Happened
- Sensex fell from 42,000 to 25,000 (-40%) in 1 month
- Mid-cap & small-cap funds fell 50-60% by March 23, 2020
- Panic redemptions: ₹87,000 Cr pulled out in March-April 2020
SIP Investors Who Stayed
- Bought units at 40-50% discount during March-May 2020
- By Dec 2020, portfolios recovered 100% + 15% extra gain
- By Dec 2021, those SIPs had generated 80-120% returns from March 2020 lows
Lesson: SIP investors who continued during the COVID crash earned their entire year's salary worth of returns in just 18 months!
1NEVER Stop Your SIP
Crashes last 6-18 months on average. Stopping means you miss buying at rock-bottom prices. This is the #1 mistake that destroys wealth. Markets always recover—all 15 major crashes in Indian history recovered within 3 years.
2Top-Up SIP if You Have Spare Cash
If market falls 20%+, deploy bonus/emergency savings to double your SIP temporarily for 3-6 months. This accelerates unit accumulation at discounted prices. Target: buy 50-100% extra units during the crash bottom.
3Don't Try to Time the Bottom
Nobody knows the exact bottom. Trying to wait for it means you miss the initial recovery rally (which is the fastest). Just keep buying systematically. SIP automatically averages your cost.
Mindset Shift Required
Train yourself to think: "Market crash = Shopping sale" instead of "Market crash = Panic & sell."
Good Investors: Buy more when everyone is selling
Poor Investors: Sell when everyone is panicking
Minimum Investment Duration by Fund Type
Equity investments need time to stabilize volatility and compound returns. Redeeming too early defeats the purpose of SIP. Follow these minimum holding periods based on fund category.
| Fund Category | Minimum Duration | Ideal Duration | Reason |
|---|---|---|---|
| Large Cap / Index | 5-7 Years | 10+ Years | Lower volatility, stable compounding |
| Flexi Cap / Multi Cap | 7-10 Years | 12+ Years | Balanced across caps, needs full cycle |
| Mid Cap | 7-10 Years | 15+ Years | High volatility, exceptional long-term gains |
| Small Cap | 10-15 Years | 20+ Years | Extreme swings, massive compounding potential |
| ELSS | 3 Years (Lock-in) | 7-10 Years | Mandatory lock-in, tax benefits + equity returns |
| Debt Funds | 3-5 Years | 5-7 Years | Goal-based parking, lower returns |
Analysis of Sensex SIP returns across different time horizons (1996-2026 data):
-5% to +18% range
Highly Volatile
8-14% CAGR
Moderate Swings
11-14% CAGR
Stable Returns
12-16% CAGR
ZERO Negative Cases!
Critical Insight: No 15-year SIP in Indian equity history has given negative returns. Time eliminates risk!
10 Common SIP Mistakes to Avoid
Even experienced investors make these mistakes that can cost lakhs in lost returns. Avoid these pitfalls to maximize your SIP wealth creation.
Stopping SIP During Market Falls
Missing the accumulation phase costs 40-60% extra wealth. Crashes are buying opportunities, not exit signals.
Lost Wealth: ₹30-50L over 20 years
Choosing Dividend Over Growth Option
Dividends are taxed immediately and kill compounding. Growth option reinvests profits automatically for exponential growth.
Lost Wealth: ₹15-25L over 20 years
Over-Diversification (15+ Funds)
Holding too many funds dilutes returns and creates tracking nightmares. 3-5 well-chosen funds are sufficient for diversification.
Impact: Returns diluted by 2-3%
Not Increasing SIP with Salary Hikes
Inflation eats static SIPs. Enable 10% annual step-up or manually increase SIP every year to maintain real purchasing power.
Lost Wealth: ₹40-60L over 25 years
Chasing Last Year's Top Performers
Past returns don't guarantee future performance. Top performers often underperform in next cycle. Focus on consistent 5-10 year returns.
Risk: 5-8% lower returns
Redeeming for Small Expenses
Breaking SIP for phone/vacation defeats compounding. Keep separate emergency fund. Let SIP investments mature for 15-20 years.
Lost Opportunity: ₹20-40L
Investing Without Clear Goal
No goal = no discipline. Define specific goals (retirement, house, child education) with timelines to stay committed during volatility.
Risk: Premature exit
Choosing Regular Plans Over Direct
Regular plans have 0.5-1% higher expense ratio (commission to distributors). Direct plans save ₹2-3 lakhs over 20 years on ₹10K SIP.
Lost Wealth: ₹2-5L
Ignoring Asset Allocation Rebalancing
As you age, shift from equity to debt gradually. 40-year-old shouldn't have 100% equity. Rebalance annually to reduce risk.
Risk: Portfolio crash near retirement
Starting Too Late (After 35-40)
Starting at 25 vs 35 creates 3x wealth difference due to compounding. Even small SIPs at young age beat large SIPs started late.
Opportunity Cost: ₹1-2 Cr
The Costliest Mistake
Mistake #1 (Stopping SIP during crashes) is responsible for 60% of wealth destruction. If you remember just ONE thing from this guide, remember: Continue SIP no matter what the market does.
SIP Myths Debunked
These common misconceptions prevent millions from starting their wealth creation journey. Let's bust these myths with facts.
Myth #1: "SIP Guarantees Returns"
Reality: SIP is an investment method, not a product. Returns depend on underlying mutual fund performance and market conditions. However, historical data shows 15+ year SIPs have never given negative returns in Indian equity markets.
Myth #2: "I Need Large Amount to Start"
Reality: You can start with as little as ₹500/month. Even ₹1,000 monthly SIP for 25 years @ 12% creates ₹1.9 crore wealth. Start small, but start NOW.
Myth #3: "I Can't Withdraw My Money"
Reality: Open-ended mutual funds have zero lock-in (except ELSS with 3-year lock-in). You can redeem partially or fully anytime. Money typically reaches your account in 1-3 working days.
Myth #4: "Lump Sum is Always Better Than SIP"
Reality: Lump sum wins only in sustained bull markets. In volatile markets (85% of the time), SIP performs better due to rupee cost averaging. Historical 20-year data: SIP beats lump sum in 65% of scenarios.
Myth #5: "SIP is Only for Young People"
Reality: While starting early maximizes compounding, even 45-year-olds can benefit. A 10-year SIP can still double your money. Adjust allocation (more debt, less equity) based on age and risk appetite.
Myth #6: "Market Timing is Essential"
Reality: SIP's biggest advantage is eliminating need for market timing. Rupee cost averaging automatically buys low and high. Even expert fund managers fail at timing—SIP removes this risk completely.
Myth #7: "SIP Works Only in Bull Markets"
Reality: SIP actually works better in bear markets because you accumulate more units at lower prices. The 2008 and 2020 crash SIP investors earned 8-12% extra returns compared to those who started in bull markets.
Myth #8: “I Need Expert Knowledge to Start"
Reality: Starting SIP is simpler than opening a bank account. Choose 2-3 index funds or flexi-cap funds, set auto-debit, and forget for 10 years. No daily tracking needed. Apps like Groww/Zerodha make it a 10-minute process.
Frequently Asked Questions (FAQs)
Final Verdict: Your SIP Action Plan
SIP is India's most accessible and proven wealth-creation tool. The difference between financial freedom and struggle often comes down to one decision: Starting your SIP today.
Begin with ₹500-₹5,000 based on income. Don't wait for "perfect timing"—there isn't one.
Set auto-debit and forget. Let discipline work silently in background for 15-20 years.
Increase SIP by 10% annually with salary hikes. This alone creates 40% extra wealth.
The 3 Non-Negotiables
About Fincado Research Team
Our team of financial analysts and certified advisors brings decades of combined experience in Indian financial markets. We analyze historical data, conduct comprehensive market research, and provide evidence-based guidance to help you make informed investment decisions. This guide is based on 30 years of Indian equity market data (1996-2026) and insights from SEBI-regulated investment practices.
Mutual Fund investments are subject to market risks. Read all scheme related documents carefully before investing. Past performance is not indicative of future returns. The views and investment tips expressed in this guide are for educational purposes only and should not be construed as investment advice. Please consult with a SEBI registered investment advisor before making any investment decisions. The projections and returns mentioned are based on historical data and hypothetical scenarios; actual results may vary significantly.
Ready to Start Your Wealth Journey?
Use our free SIP calculator to see exactly how much your monthly investment can grow. Plan your financial freedom today.